
I’ve had the very great pleasure over the last year and a half of collaborating with Gustavo Romanillos, a PhD student based in Madrid, who has been working with a team there in Madrid Cycle Track to carry out some fascinating cycling studies in the city. We’ve recently published two pieces of work together, and done some rather nice visualisation.
The first collaboration is a review paper on Big Data and Cycling, a topic which has a remarkable amount written about it, and so having the opportunity to survey this field (with the help of domain experts from across Europe) was fascinating. I should probably point out that these papers were both published in paywalled journals (which is not my first choice, but (no) budget demanded it) , but that you can download the unformatted final version from UCL discovery here if you can’t get the final published version.
[EDIT: It’s been pointed out to me that the UCL Discovery version will only be available 6 months after publication. I’m unused to this clunky closed-access way of doing things, sorry – I’ll try to remember to put stuff on the arxiv in future]
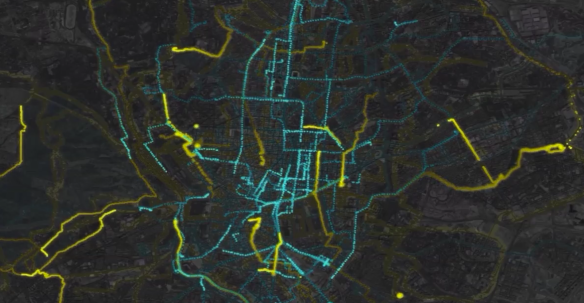
Our other paper (published version: here, UCL version: http://discovery.ucl.ac.uk/1472944/) was in the Journal of Maps, based on our work to visualise the Madrid Cycle Track project. In this project, GPS tracking apps were disseminated to cyclists in Madrid, resulting in over 300 users contributing nearly 3,000 journeys. The work in this paper focussed on the visualisation aspect of this – Gustavo has created onllne maps which highlight the complexity of this system, and the “choke points” where cycling traffic peaks. As is my wont, I’ve created an animation of these GPS tracks, boiling down months of data onto one day. This will include users who make the same journey multiple times with only slight variations to route or pacing, but rather than colour-coding it by user (there would be 300+ colours), I’ve split the data into two colours – yellow, which represents “regular” users, and cyan (blueish), which represents journeys taken by cycle couriers. You can see big differences in the speed and geographical coverage of these two groups.
The code was written in Processing – Gustavo had ingested the GPS routes into a MySql database, and I used an “internal clock” in Processing and an SQL connector to query the data every few seconds of simulation time (obviously the visualisation is faster than real-time, or you’d be watching it for 24 hours!). Processing has its own ways of working with GPS data (.gpx is readable using Processing’s XML libraries, and the Unfolding library has methods for playing nicely with .gpx data), but the dataset is large enough that trying to load more than a few journeys into memory would cause my computer to stumble. This code is relatively straightforward, in fact – because the GPS is collected regularly, there’s no real reason to use interpolation between data points – you can just draw each data point individually, and they’re close enough together in time that this provides an adequate sense of continuity. This in turns means that you don’t *have* to use an object-oriented/agent-based approach – you don’t have to worry about the existence of the same “bike” from one second to the next, you can just treat each point as something to be drawn on the screen at a particular time. This makes the code much, much simpler. If people are sufficiently interested, I’m happy to GitHub it – just let me know.*
The long-term goal of this work is to understand the cycling preferences and patterns of these users, with an eye to modifying street infrastructure to enable cycling. The recurrent problem with urban cycling is that in many cities it is uncomfortable and risky, leading to a very skewed demographic of young men who are prepared to take those risks. Understanding the factors that dominate people’s preferences (slope, traffic, cycle lanes, green space) has been carried out in a number of cities (I’m most aware of the examples in San Francisco and Austin) and can go some way to creating cyclable streets. Of course, the very obvious criticism about a study which relies on cyclists using a smartphone app is that it narrows the demographic even further! Until we can either find smarter ways to getting GPS or tracking technologies into people’s hands, or smartphone usage/people who are likely to contribute to such a study broadens, it’s all we have from a large-scale, quantitative perspective (beyond the highly disaggregate travel to-work-style surveys). In that sense, we must be sensitive to its limitations – especially with a mode of transport that is inexpensive as has the potential for positive health benefits but is, in many cases, confined to the wealthy or middle-class; “empowering the empowered” is a well-established critique of “smart city” approaches to urban problem solving (see for example, Rob Kitchin’s pithy take on open data).
I hope to be involved in more work on the topic, and think about how we tackle these problems without losing the benefits of scale that are growing from studies like this. As ever, watch this space.
*If you’re interested in the original soundtrack, I’ll negotiate release with my record label

Note that the UCL discovery URLs are embargoed access for at least 6 months 2016 for non-UCL students/faculty – only your immediate colleagues can access them.
This is an awesome way to display data!
What visualisation software did you use?